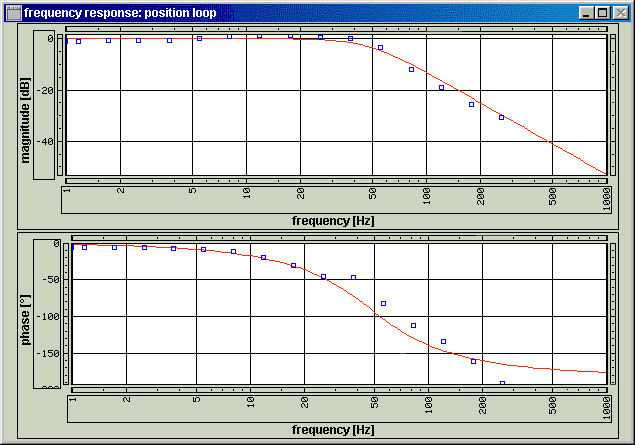
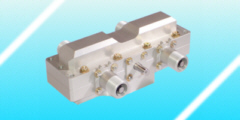
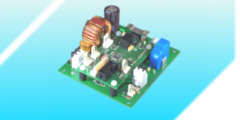
Example: measurement of a frequency response (Bode diagram)
The measurement of a frequency response and the resulting Bode plot (magnitude resp. phase over frequency) is a good tool to check the status of an actuation system during the development or prior to the delivery. During the development it is helpful to display the measurement together with a theoretical prognosis. In an acceptance test for delivery pass and fail limits help to evaluate the quality of the product.
